
Three Years of TTC Delays
By: William Davis and Tom Weatherburn
The Toronto Transit Commission (TTC) recently published subway delay data to Toronto's open data portal. The data contains over 69,000 entries and spans from January 2014 to April 2017. The animation below shows total monthly delays (in hours) over that time period.
Total delay time by month Jan. 2014 - Apr. 2017
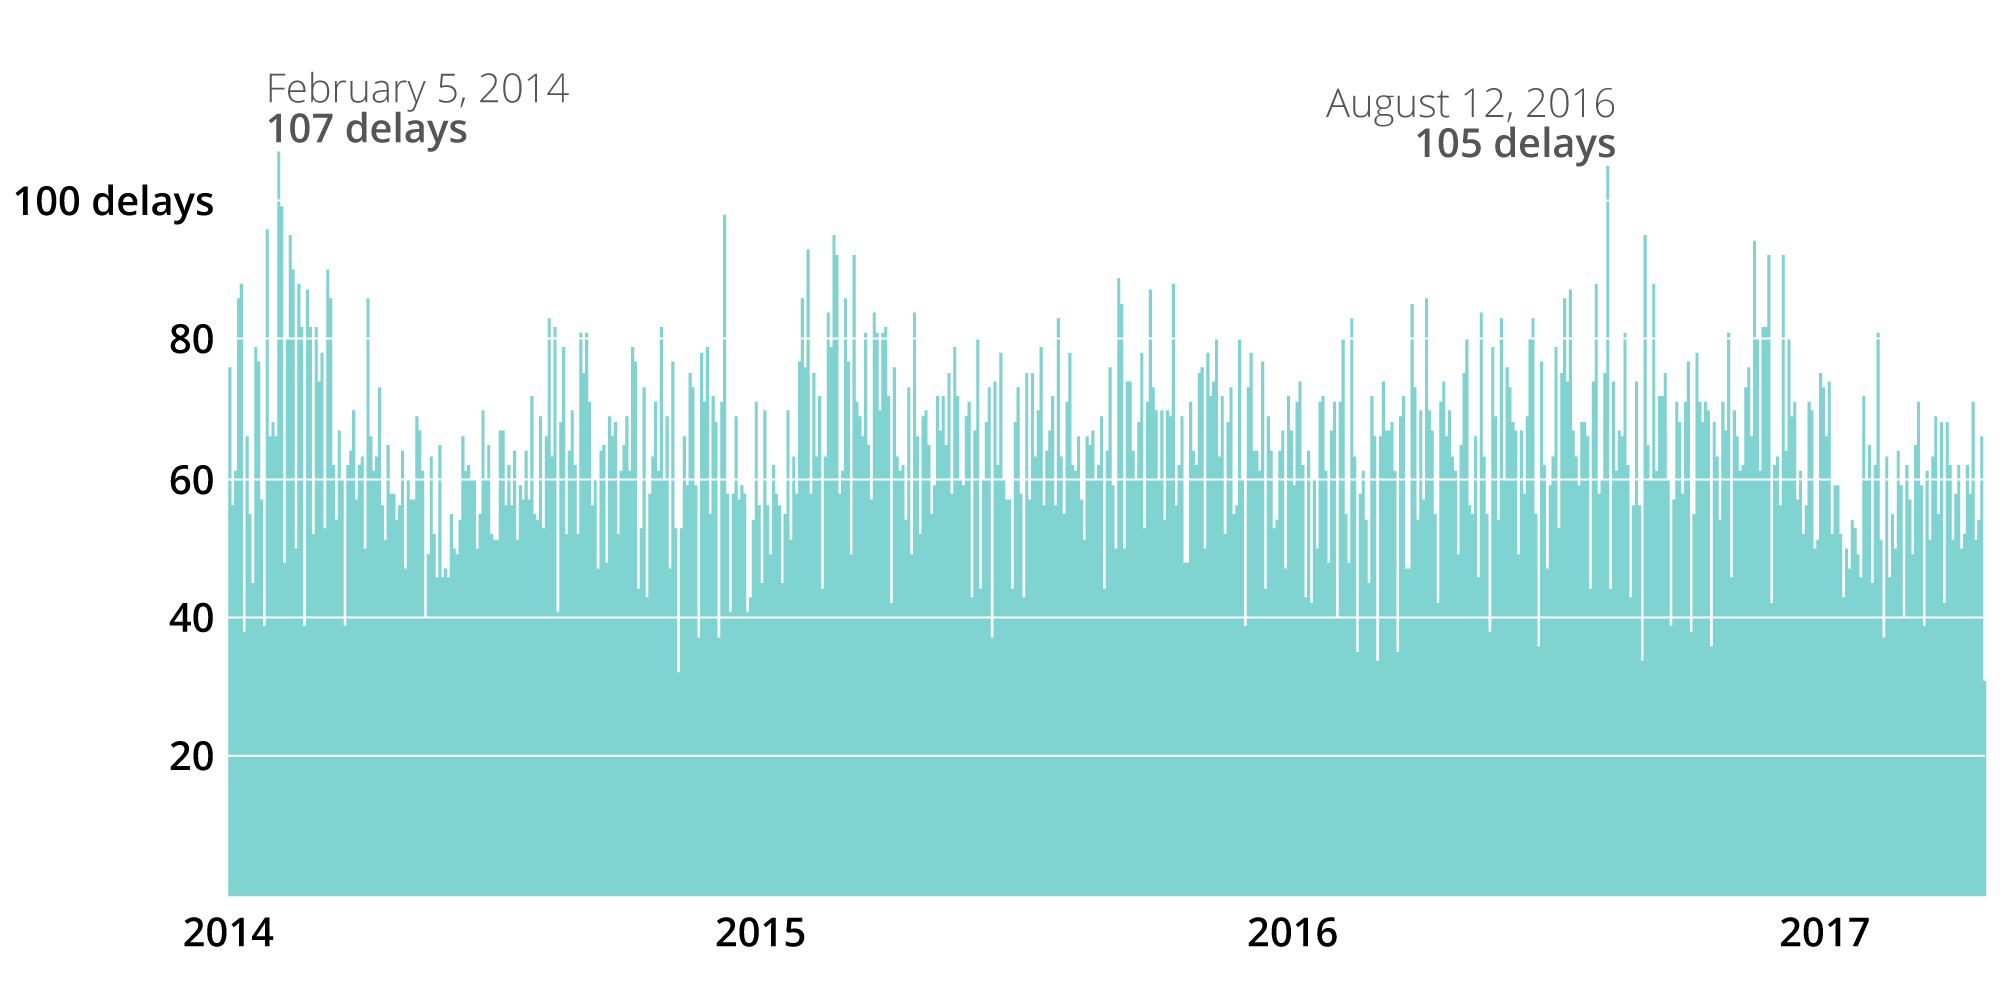
The number of delays on any given day ranges from 18 to 107. The average between 2014 and 2017 is roughly 57 delays per day with an average delay time of 1 minute and 49 seconds. Approximately 73% of all delays are less than a minute.
Total delays
Delays by TTC station*
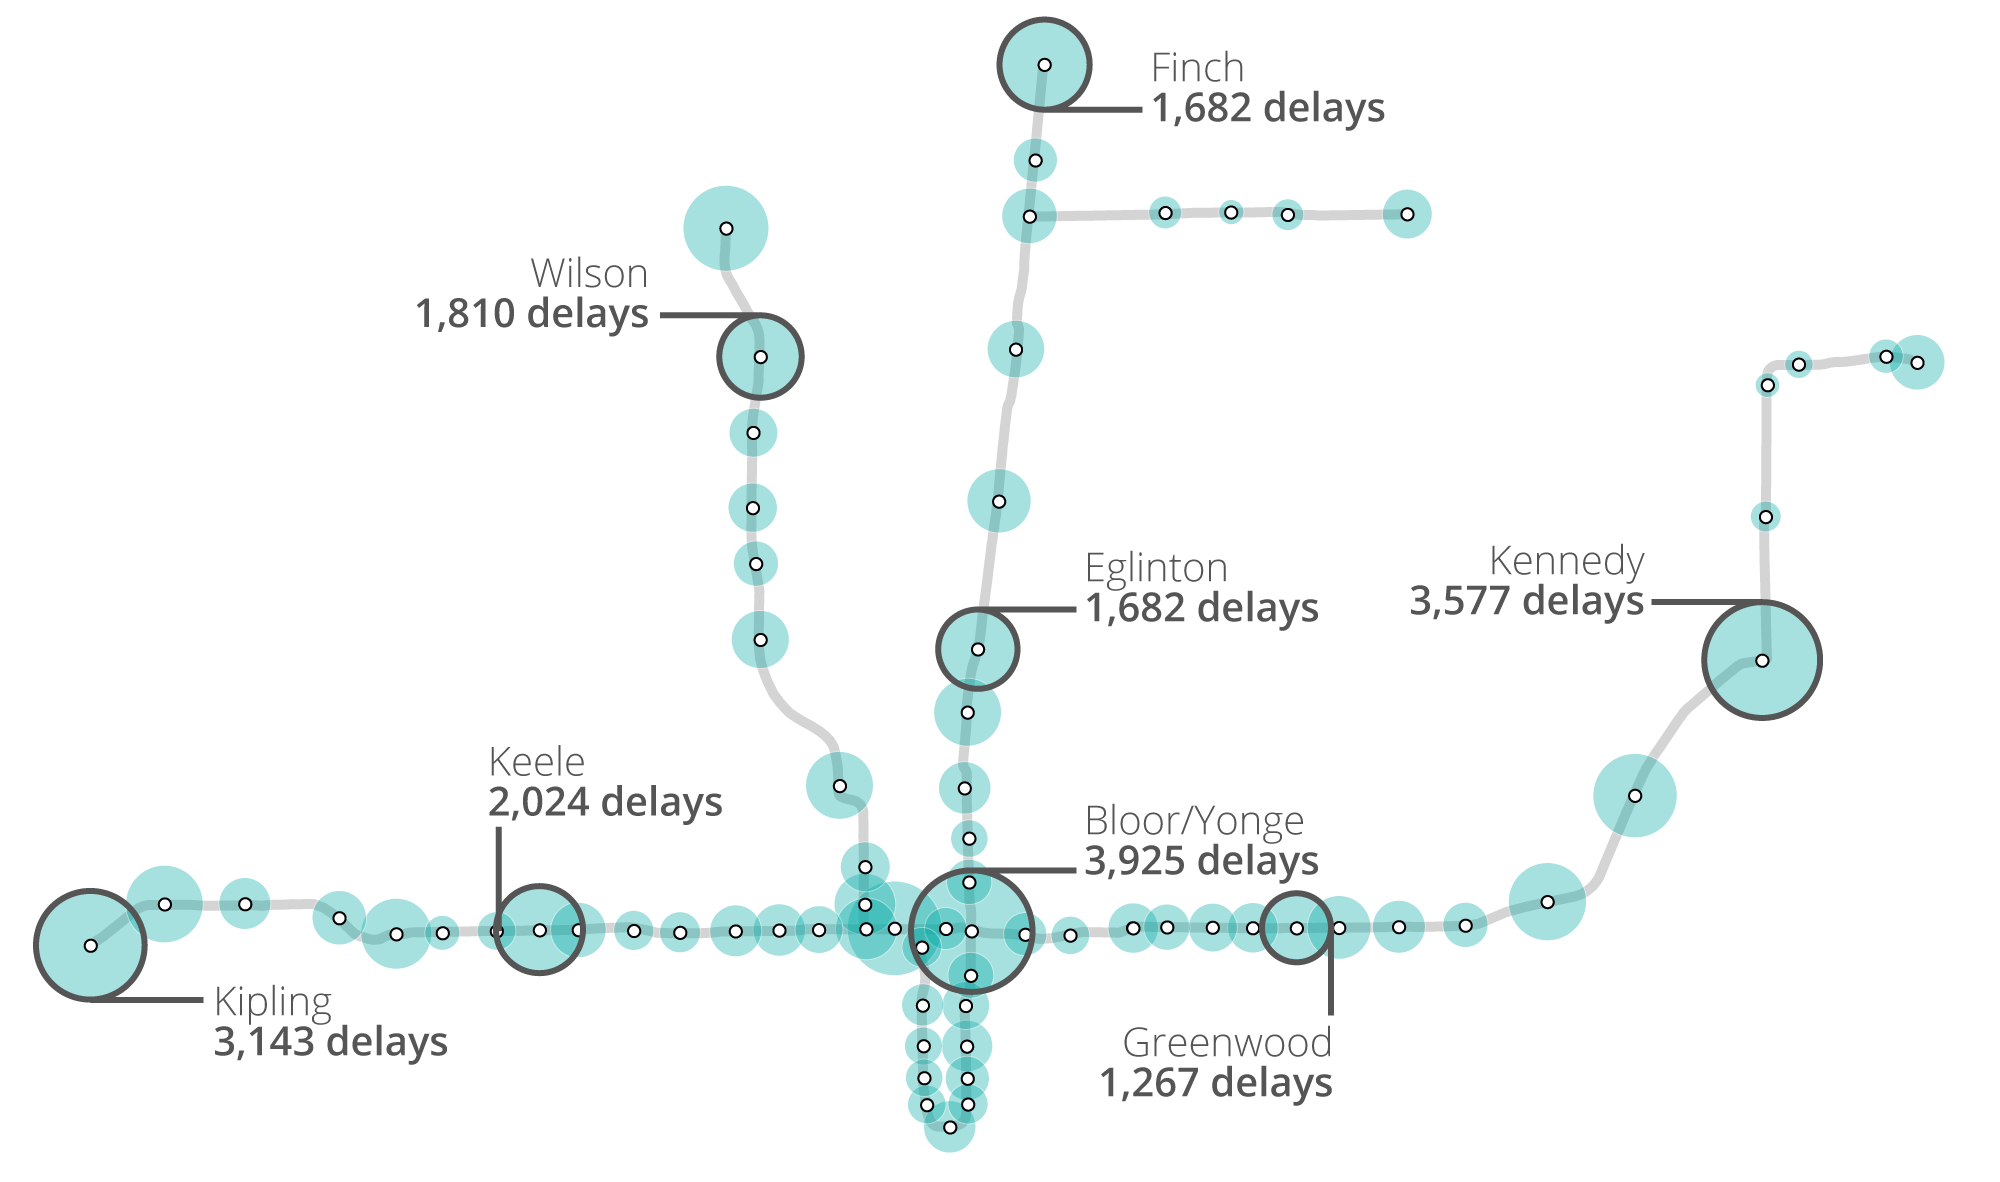
The map above shows a high-level spatial distribution of delays across the subway network. Bloor/Yonge station has the single highest number of delay incidents, followed by Kennedy, Kipling, Keele, Wilson, Eglinton, Finch, and Greenwood. Further analysis on types of delays by station will provide insight as to why these stations saw the largest number of delays.
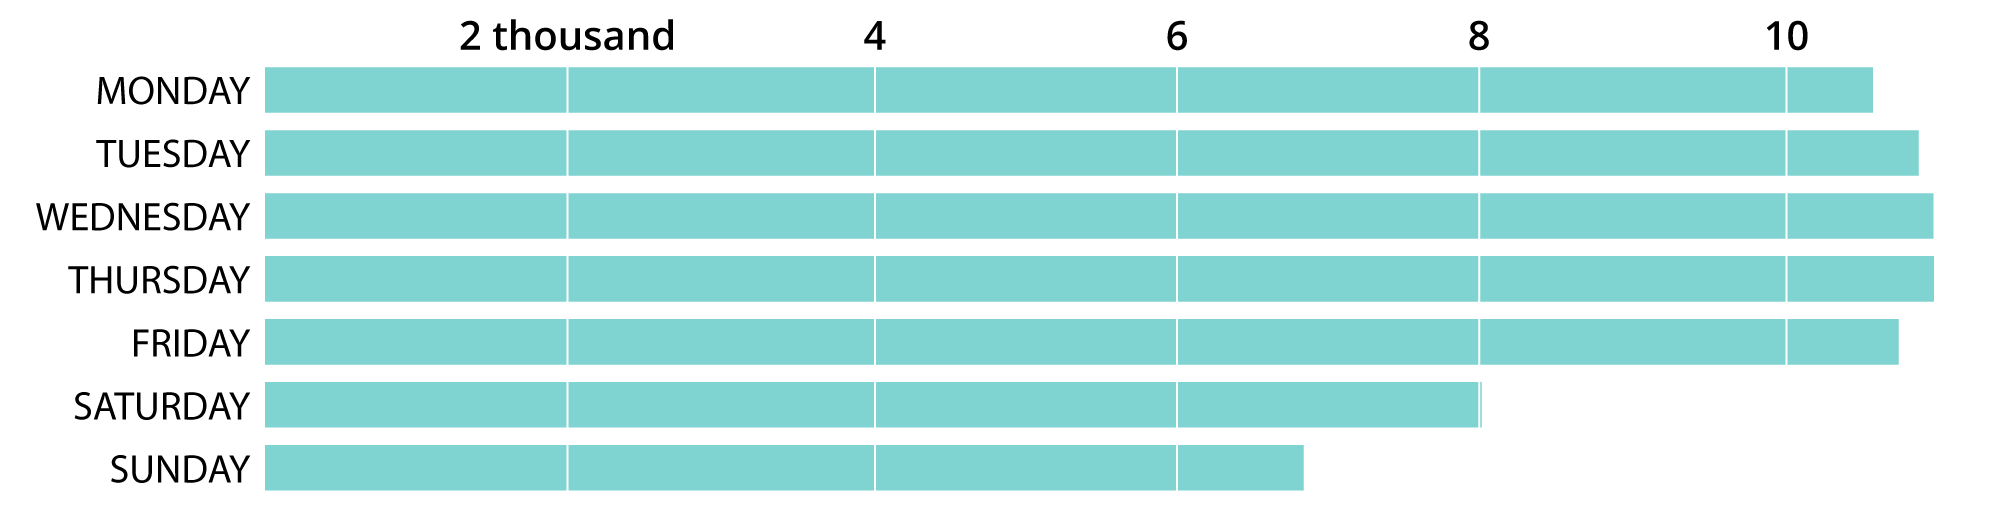
The number of delays is largely consistent across the weekdays. Thursday is only slightly higher than Tuesday and Wednesday. Sunday has the least number of delays.
Delays by weekday
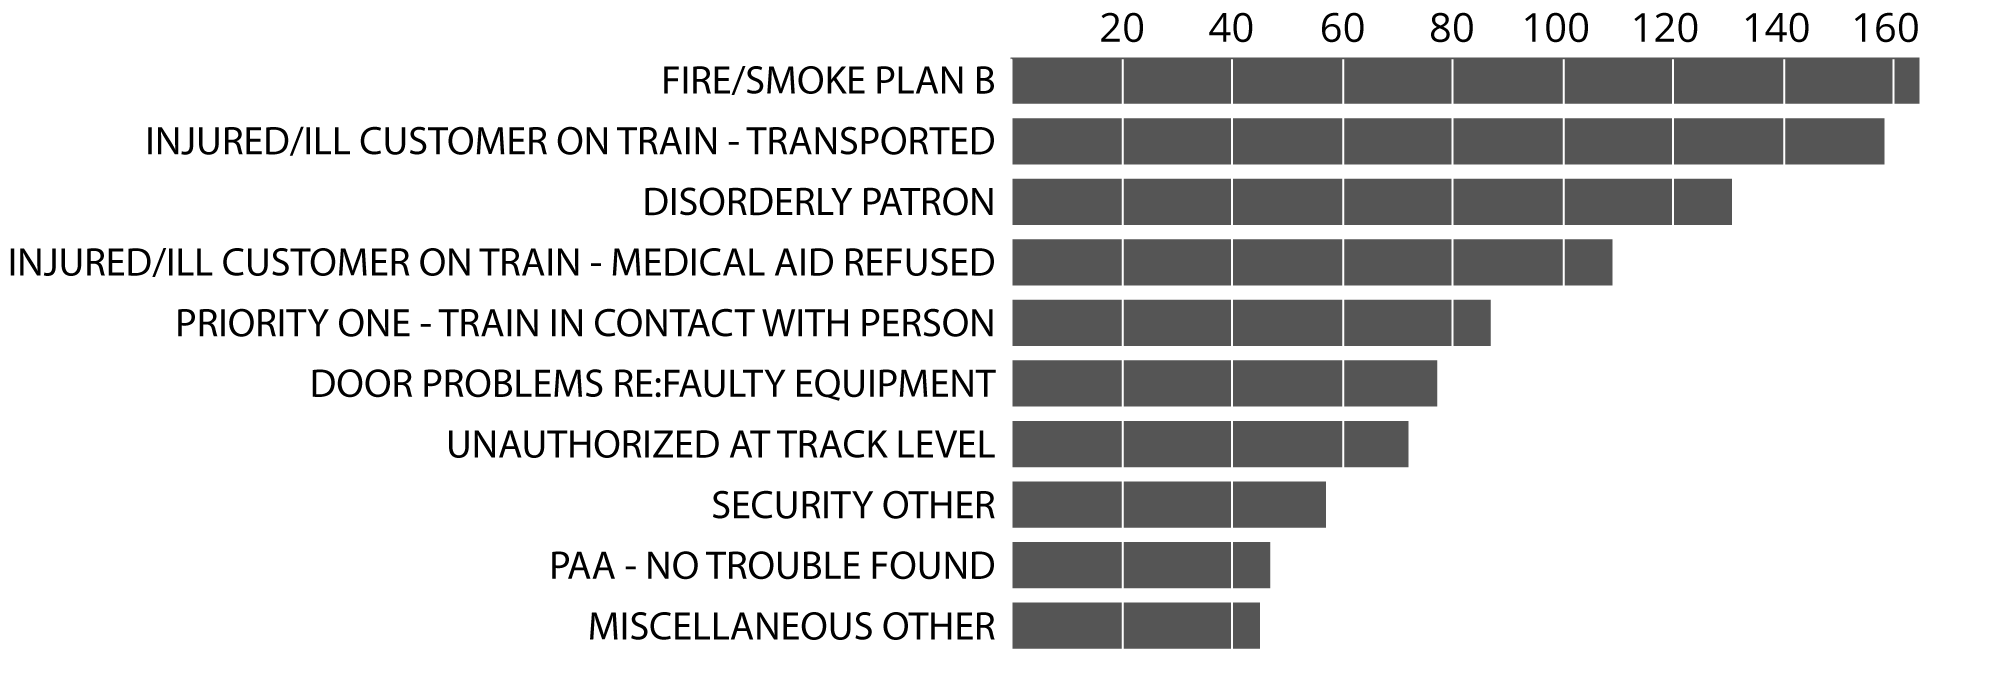
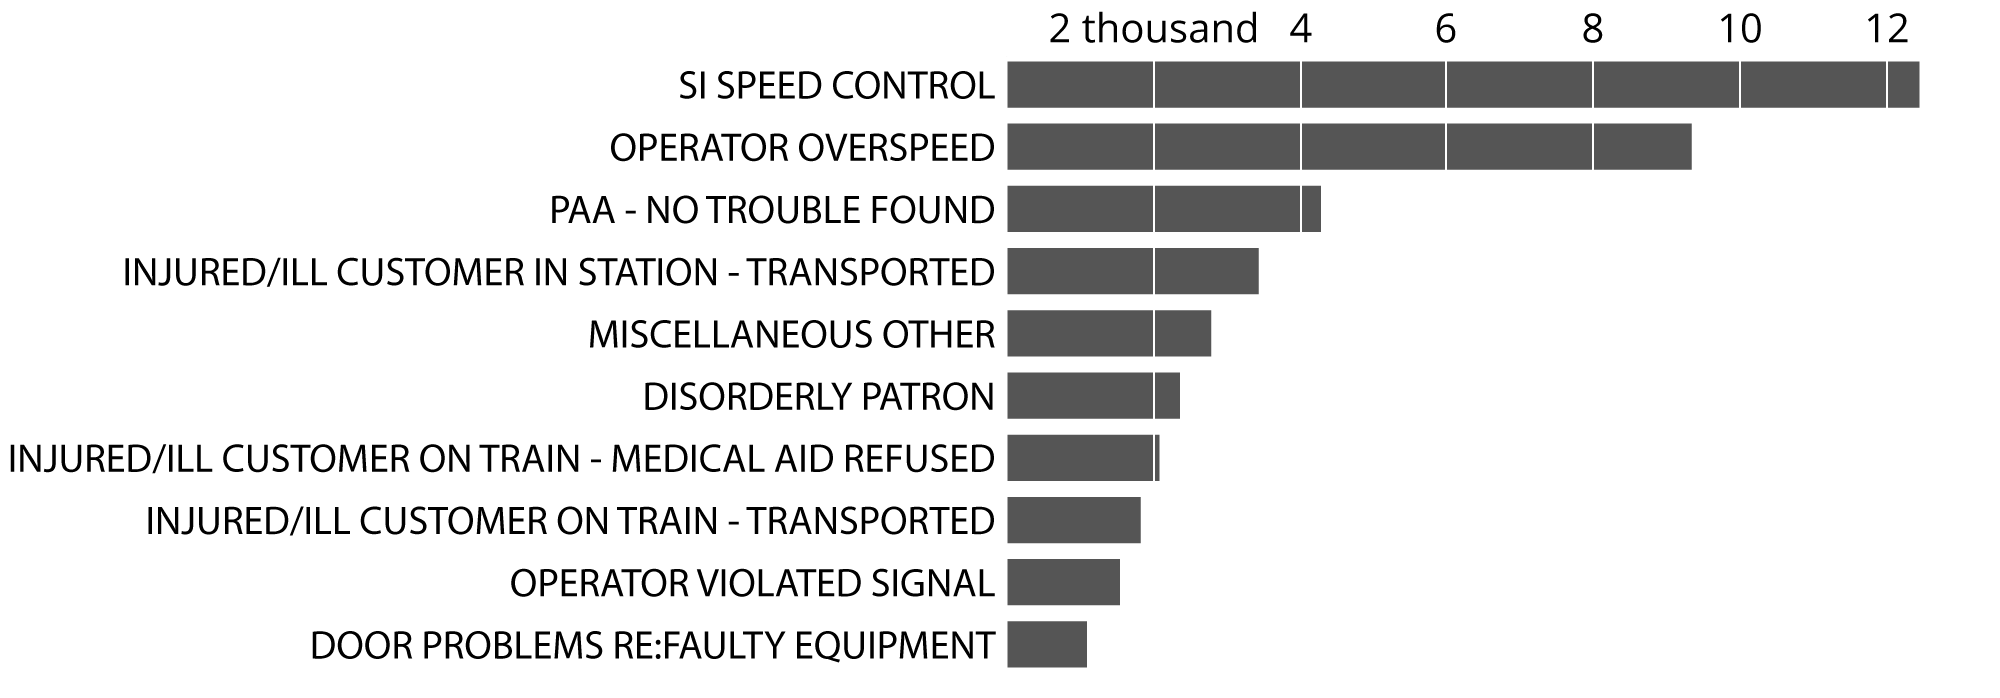
These bar charts show the top causes for service delays by total delay time and by count of incidents. Disorderly patrons caused nearly 130 hours of delays over this time period!
Top 10 types of delays by total delay hours
Top 10 types of delays
Each delay type has the potential to be an entire post in itself, so in advance of some deeper analysis we've done a breakdown of some of the more serious reasons for subway delays.
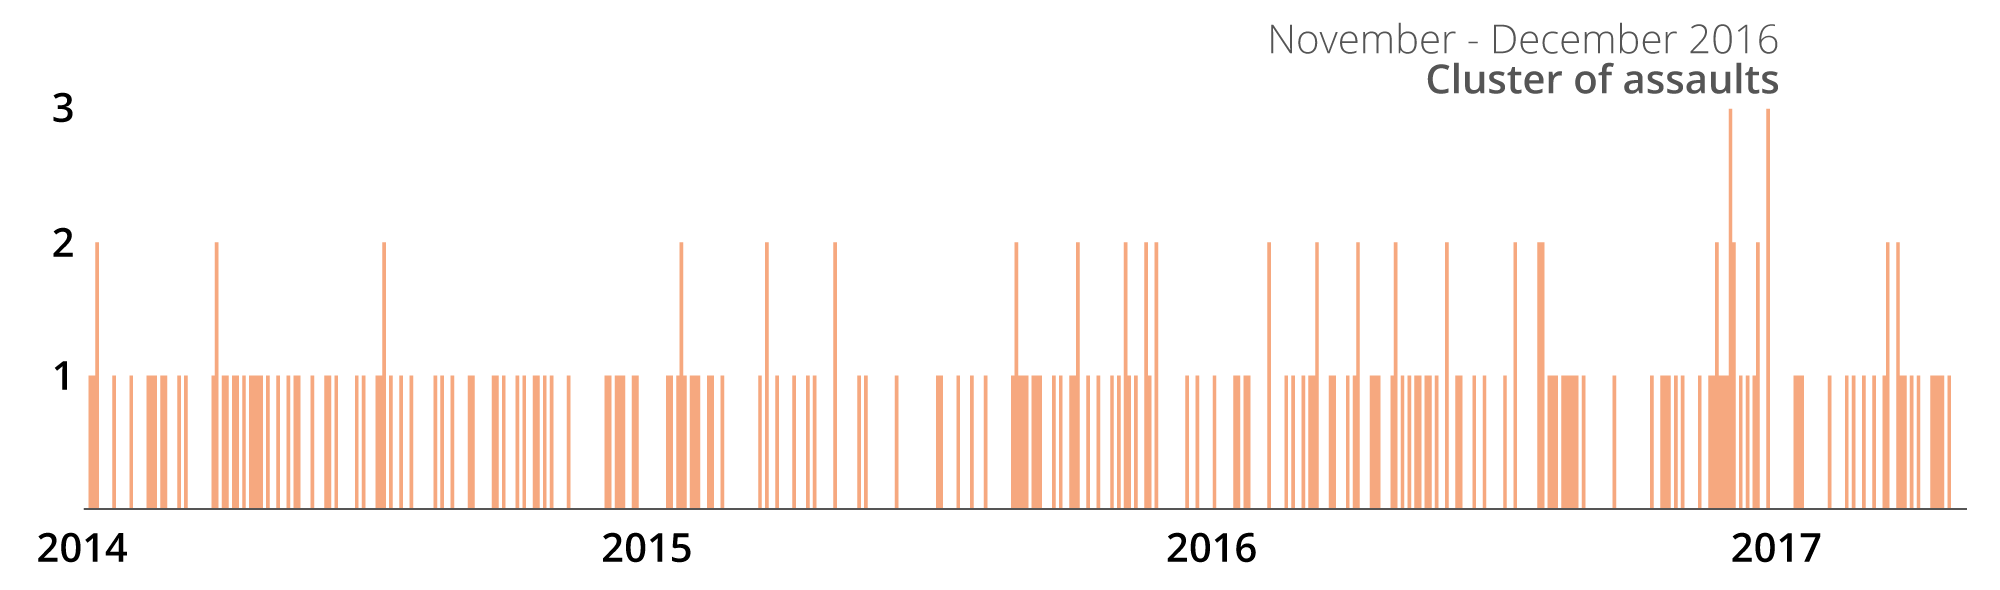
Delays caused by assaulting an employee
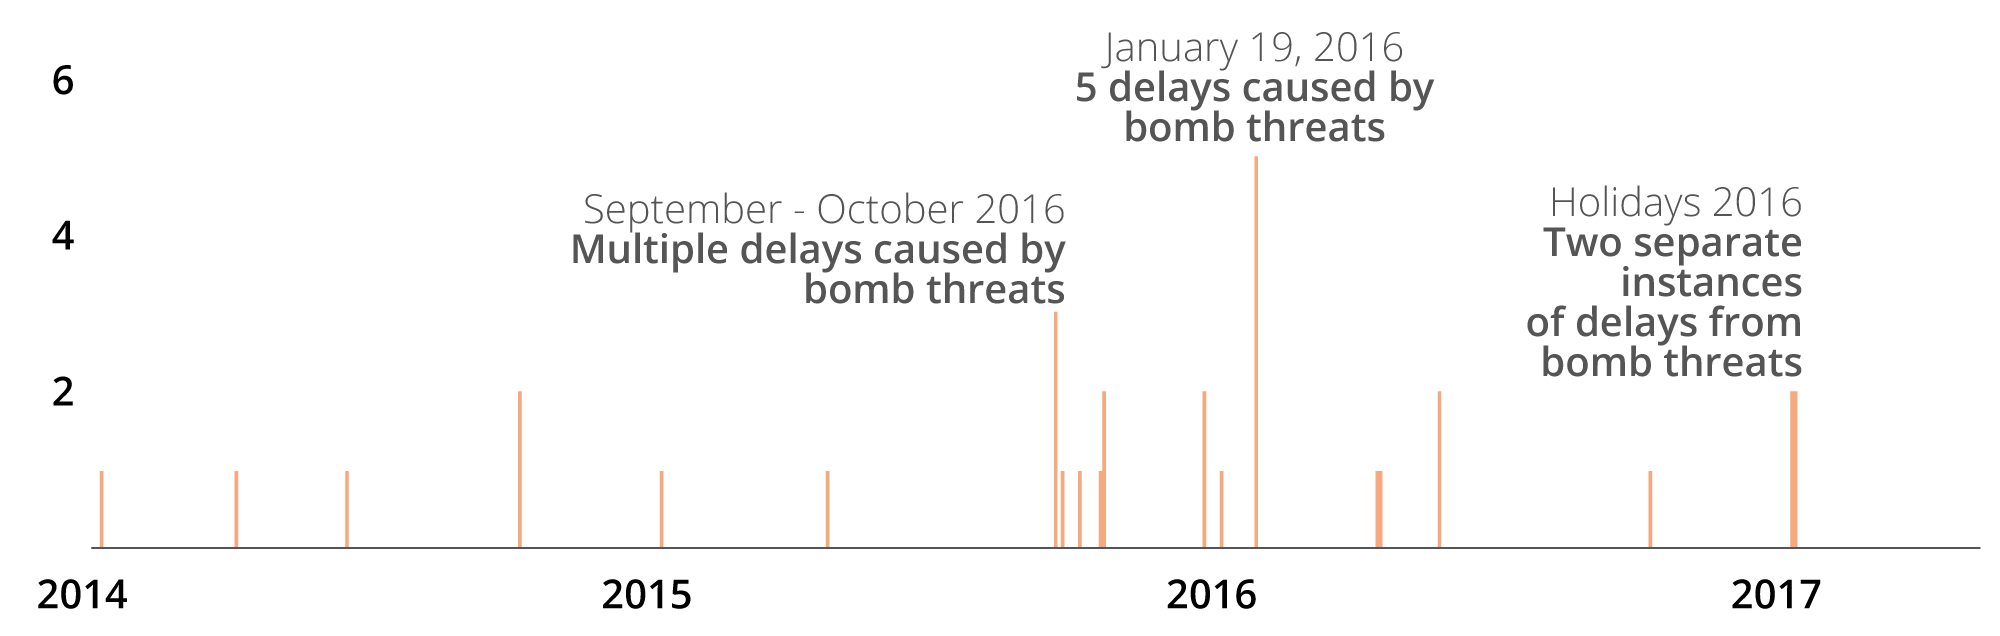
Delays caused by bomb threats
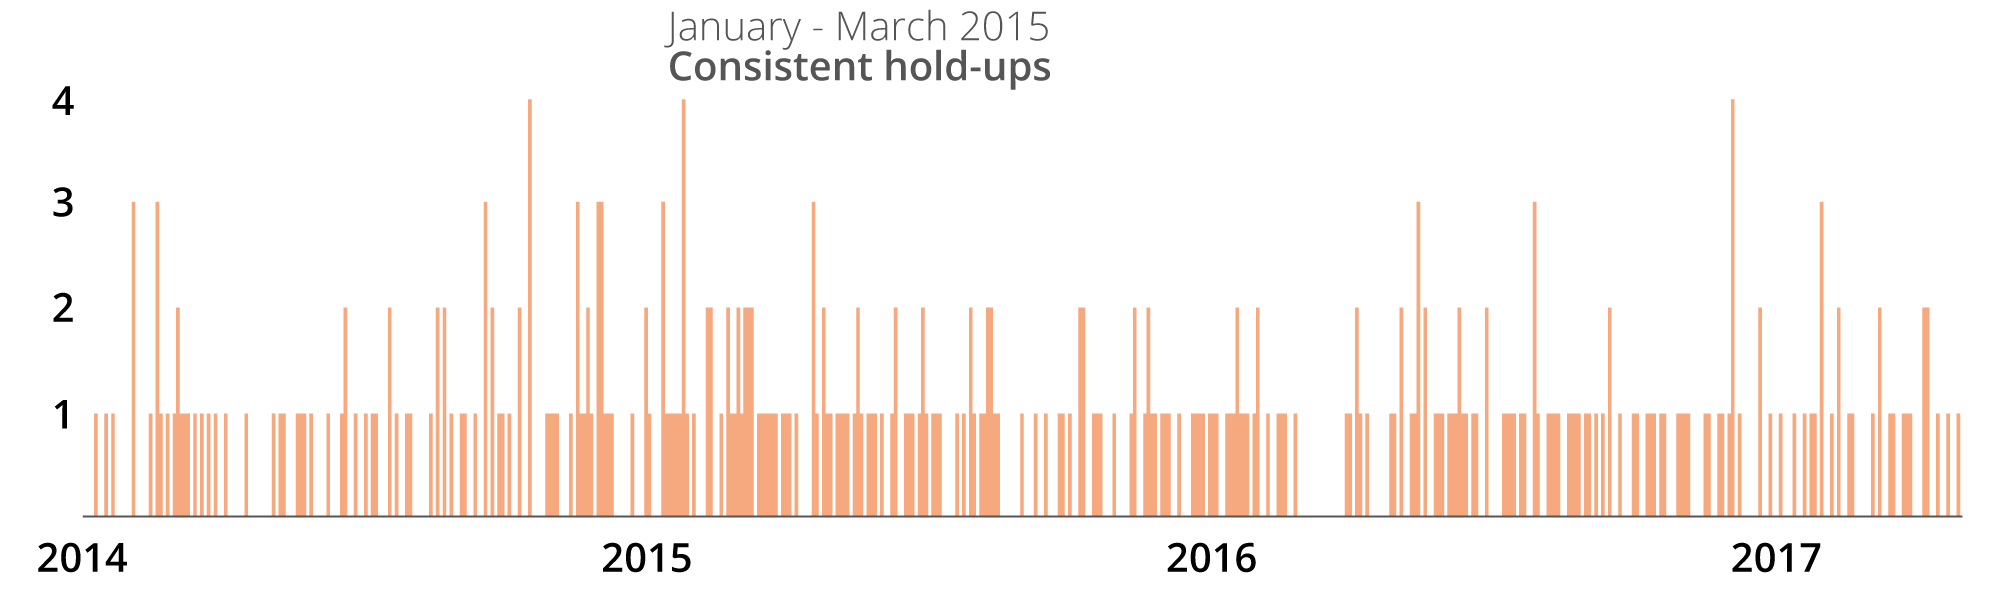
Delays caused by collector booth hold-ups
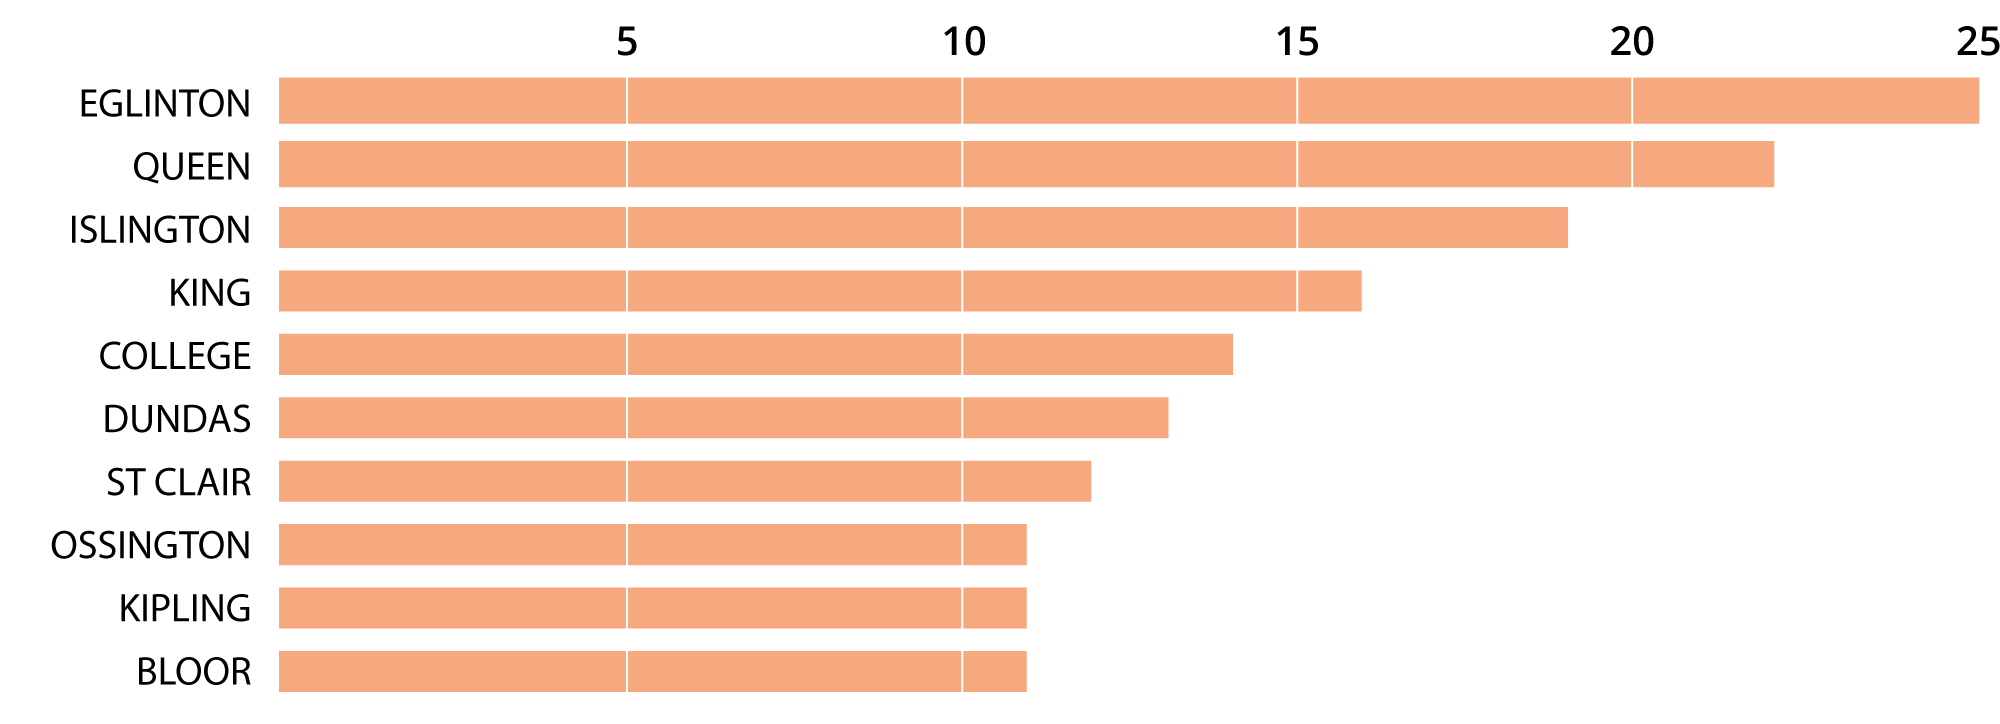
Delays caused by collector booth hold-ups by station
Its incredible that the TTC released such detailed data. It offers a great insight into all of the complexities within the system. You can also see that TTC employees come in contact, fairly regularly, with some serious criminal activities.
There is a lot more to be extracted from this data and we'll definitely be diving into it again soon.
* The data is messy. Inconsistent station names sometimes made it hard to determine if the delay actually occurred at the station or between stations. Any entries that contained 'station name to station name' were counted as other and wouldn't show up on the image (subway map). Station yards (ex. Davisville yard) were also included in the station count. The counts could be incomplete.

